Robert Nakano

Robert Nakano

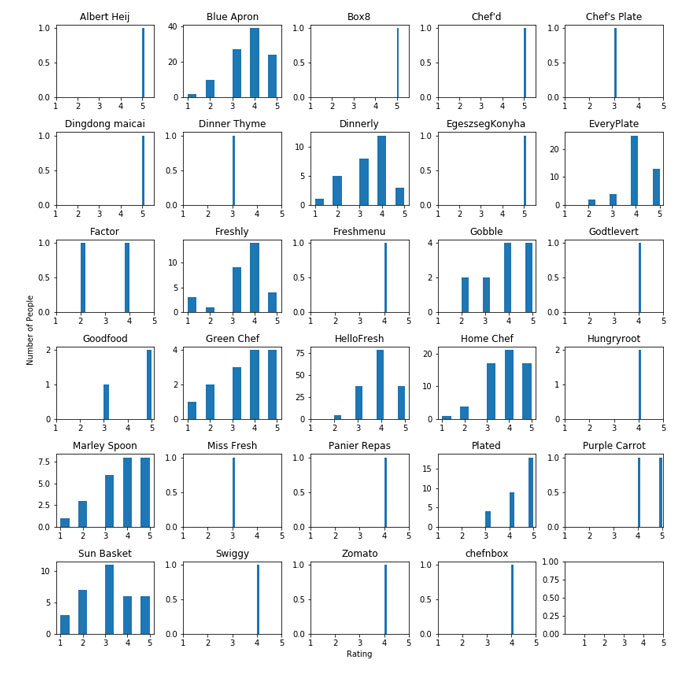
Exploratory Data Analysis on Meal Kit Service Data

Thesis Slides

Methods: Heat Maps, Histograms, Bar Charts

Abstract

With the growth of the meal kit industry consumers are faced with a plethora of meal delivery service options. This study surveys current and potential meal kit customers and predicts optimal meal kit choices using statistical and machine learning techniques including user- and item-based collaborative filtering content-based filtering and deep learning approaches. The large number of potential customers who sampled a small percentage of meal kit options presents a challenge in generating optimal predictions. This study implements and discusses the advancement of web-survey methodology and evaluates prediction methods when dealing with sparse data with the goal of providing an optimal model for predicting consumer meal kit service choices.

Summary

One of the fun parts of running a survey is the opportunity to perform EDA (exploratory data analysis). Meal kit service ratings can be visualized a set of histograms using matplotlib. Heat maps are a great way to see the sparsity of ratings data. Sometimes the best visualizations are simple barcharts. Check out Pick a Kit Early Survey Results for more survey details regarding the Pick a Kit Meal Kit Survey results.